Recently I got a Texas Instruments MSP430F5229 Launchpad and seached for an easy way to try it with my CC3000 Boosterpack. One of the first ideas was a wireless sensor node with a simple web server providing data for late analysis.
First the controller reads an analog value from an light sensitive resistor and than it provides a JSON file for download (especially for its flexibility to add or change values / parameters) which is polled. This analyisis and safe-step was done via requests and pickle python librarys.
So first to the code providing the JSON file on the web server running within the MSP430 launchpad. I programmed it for quick development in Energia and started with the example program for Simple Web Server created by Robert Wessels (who derived it from Hans Scharler).
First step is to chang the SSID and passwort to allow the connection.
#define WLAN_SSID       "myssid"
#define WLAN_PASS       "mypassword"
Then add the definition for the analog pins
int analogPin = A0;     // analog pin
int val = 0;           // variable to store the value read
The client gets the right file when browsed to xxx.xxx.xxx.xxx/data.json (check the IP adress) with
        if (currentLine.endsWith("GET /data.json ")) {
          statusConfig = 0;
          printData();
        }
within the void loop subprogram. This calls printData();.
void printData() {
  //Serial.println("Print Data");

  client.println("HTTP/1.1 200 OK");
  client.println("Content-type:application/json; charset=utf-8");
  client.println();
  val = analogRead(analogPin);    // read the input pin
  //Serial.println(val);             // debug value

  client.println("[");
  client.println("{");
  client.println("\"light_sensor\": {");
  client.print("\"value\": ");
  client.print(val);
  client.println("}");
  client.println("}");
  client.println("]");

  client.println();
}
which reads the analog sensor and provides the JSON-file to the client:
[
    {
        "light_sensor": {
            "value": 773}
    }
]
The hardware setup itself is more or less simple a 1K R is connected between ground and pin A0 and the photoresistor is connected between +5 V and A0. Than program the launchpad and supporut it with power (with attached booster pack).
Now to the server side. A simple python script polls the data using requests and exception handling i.e. timeouts (necessary because the server is not a google server…) (function read_json_data):
from __future__ import division, print_function
import requests, json
import time
import datetime
import numpy as np
import pickle
import socket

## Read Light Measurement Data from IP via JSON-File
# Michael Russwurm 2014
# under GNU GENERAL PUBLIC LICENSE Version 3, 29 June 2007

print("# Gathering Light Sensor Measurements #")
print("Started at ", datetime.datetime.now())

def read_json_data(url_string, time_out):
    """Reads Data from url string in JSON format.\n
    Returns False if not working properly or JSON object without errors.
    time_out in seconds defines request duration.
    Imports needed: json, requests and socket.
    """
    exception = False
    try:
        req = requests.get(url_string, timeout=time_out)
        # print( r.json()
        #print(r.encoding)
        #print(r.text)
    except requests.exceptions.RequestException as requests_error:
        print ("Error: ", requests_error)
        exception = True
    except socket.error as socket_error:
        print("Error: ", socket_error)
        exception = True
    if exception is False:
        data = json.loads(req.content)
        data = data[0] # data[0][...][...] not necessary anymore
    else:
        data = False
    return(data)

COUNT = 100 # x100
for j in range(COUNT):
    data_array = []
    for i in range(100):
        # change IP adress HERE, 30 s timeout
        data_point = read_json_data('http://xxx.xxx.xxx.xxx/data.json', 30)
        time.sleep(5)
        if data_point is not False:
            data_array.append([datetime.datetime.now(),
                               data_point["light_sensor"]["value"]])
            #print("Light Sensor: ",data_point["light_sensor"]["value"],
                               #" No. ",(i+1))
        else:
            #print("Light Sensor: ERROR "," No. ",(i+1))
            time.sleep(30)
    print("Try to append to existing file")
    try:
        data_array = np.append(pickle.load(open("light_sensor_data.p", "rb")),
                         np.array(data_array), axis=0)
        print("Existing file found - append to existing file")
    except IOError:
        data_array = np.array(data_array)
        print("No existing file found - creating new one")
    pickle.dump(data_array, open("light_sensor_data.p", "wb"))
    print("Saved at ", datetime.datetime.now())
print("Finished")
A for loop polls the site every 5 seconds and converts integer number and appends it together with an timestep (datetime.datetime.now()) to a list ( data_array ). After 100 values the whole array is safed in a new file using pickle to safe file size. A if/else condition checks if there is already a file and would append it. Another advantage of this approach is that it is possible to restart the programm with a max. loss of 100 measurement points.
Last but not least another script reads the data and plot it:
from __future__ import print_function, division
import pickle
import matplotlib.pyplot as plt
from matplotlib import dates

## Print Light Sensor Data
# Michael Russwurm 2014
# under GNU GENERAL PUBLIC LICENSE Version 3, 29 June 2007

data_array = pickle.load(open("light_sensor_data.p", "rb"))
print("# Plot Light Sensor Data #")
#print(data)

# matplotlib date format object
hfmt = dates.DateFormatter('%d.%m.%y %H:%M')
fig, ax = plt.subplots(1, 1)
# 12 bit = 4095, 3.3 V
ax.plot(data_array[:, 0], data_array[:, 1]/4095*3.3, "--o", label="Brightness")
ax.grid()
ax.legend(loc="lower right")
ax.set_ylabel("Brightness Sensor Output [V]")
ax.set_xlabel("Time")
ax.set_title("Light Sensor Data")
ax.xaxis.set_major_locator(dates.AutoDateLocator())
ax.xaxis.set_major_formatter(hfmt)
plt.gcf().autofmt_xdate()
plt.show()
This piece of code is also responsible of converting the AD-values to voltage values (lux conversion would be possible wiht calibration).
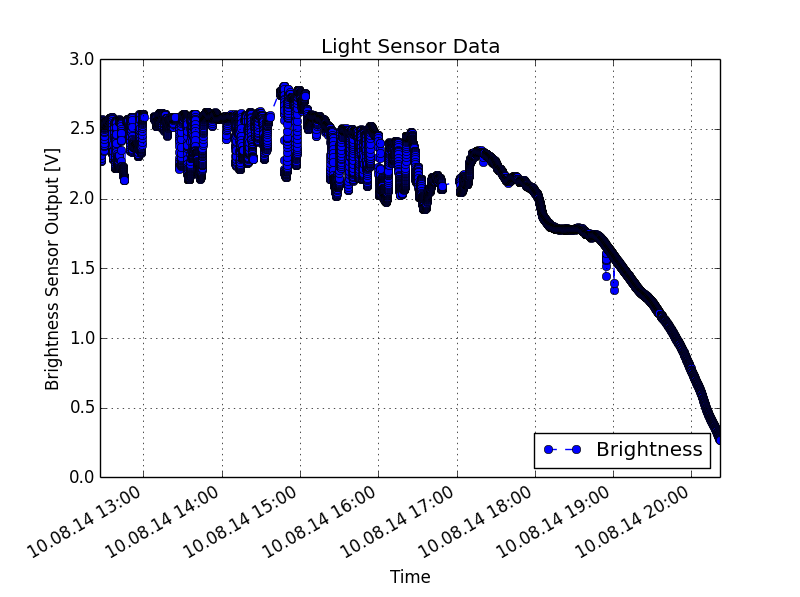
The result looks somthing similar to this:

This system is easy adaptable to more than one sensor or even more than one sensor node (although not very cheap).